kubernetes监控-Prometheus 指标优化
优化 Prometheus 未被使用的指标,减少 Prometheus 资源占用.
写在前面
开源的 Prometheus 使用一段时间后,发现其内存使用率、磁盘使用率一直居高不下,特别是 Prometheus 又是部署在 kubernetes 集群内的,严重占用集群的物理资源。
高内存原因:
prometheus 的内存消耗主要是因为每隔 2 小时做一个 block 数据落盘,落盘之前所有数据都在内存里面,因此和采集量有关。加载历史数据时,是从磁盘到内存的,查询范围越大,内存越大。这里面有一定的优化空间一些不合理的查询条件也会加大内存,如 group、大范围 rate 。
优化方案:
-
做分片,然后通过 victoriametrics,thanos 等方案合并数据。
-
评估哪些 metric 和 label 占用较多,去掉没用的指标。
-
调整指标抓取时间间隔。
-
查询时尽量避免大范围查询。
-
调整数据落盘时间。
减少指标
另外,经过查阅资料了解,我们也可以通过减少各类 exporter 的指标,来减少 Prometheus 对其指标的抓取,从而达到减少资源占用的目的。
exporter 指标可以根据不同类型的 exporter ,针对性地设置 flag 关闭一些不必要的指标采集来做优化,比如 node_exporter 可以设置以下 flag 关闭某类指标的收集。
|
|
我们这里重点记录一下,怎么通过过滤未被 Grafana 或 Prometheus 规则使用的指标,并将其配置为废弃指标的。
分析指标
指标分析我们可以根据 2 种情况,一种是使用 Prometheus 的语句或 UI 分析,一种是使用工具 mimirtool 来分析,后者对于指标数量较多、指标使用情况比较复杂的场景下比较有用。
我们都分别介绍一下。
使用 UI 分析
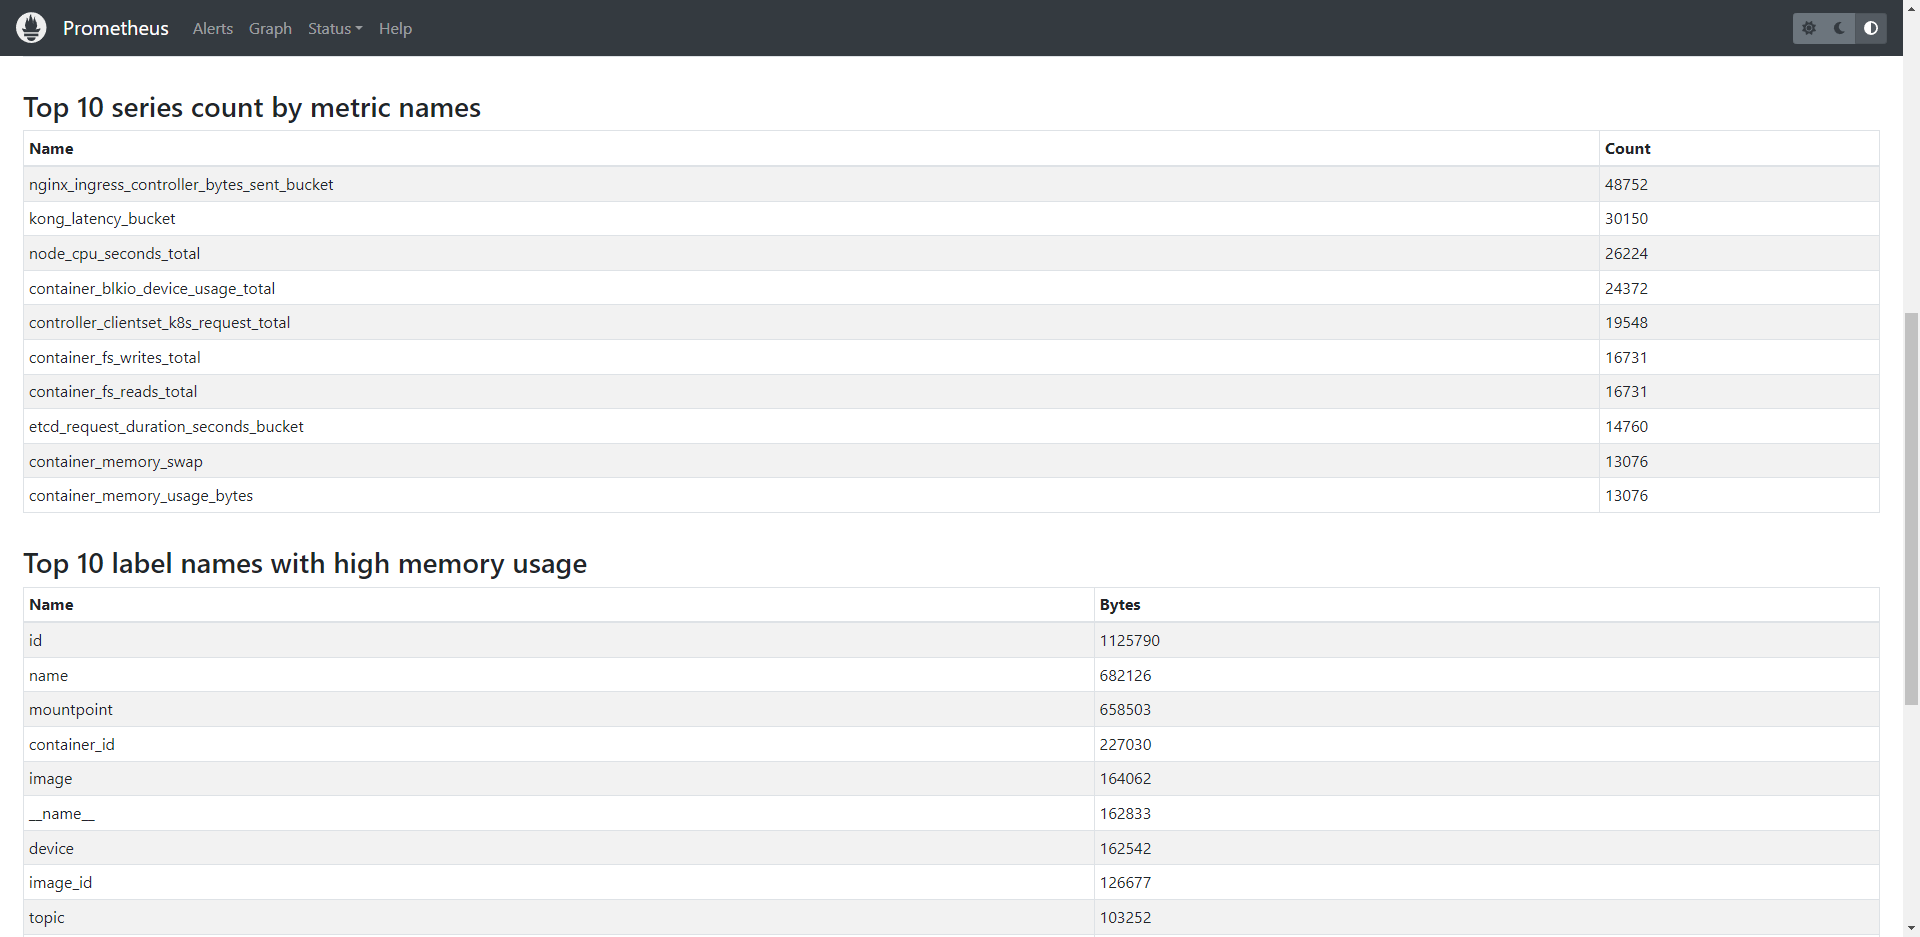
从 Prometheus v2.14.0 以后,我们可以从 UI 上面的 Status –> TSDB Status 这里获取各种 Top 10 的指标,如果使用情况没有太复杂,可以用这种方式分析查找指标。
我们重点关注 Top 10 series count by metric names 这一块的指标。
对于无法从 UI 获取的,我们可以通过 promql 获取:
topk(10, count by (__name__)({__name__=~".+"}))
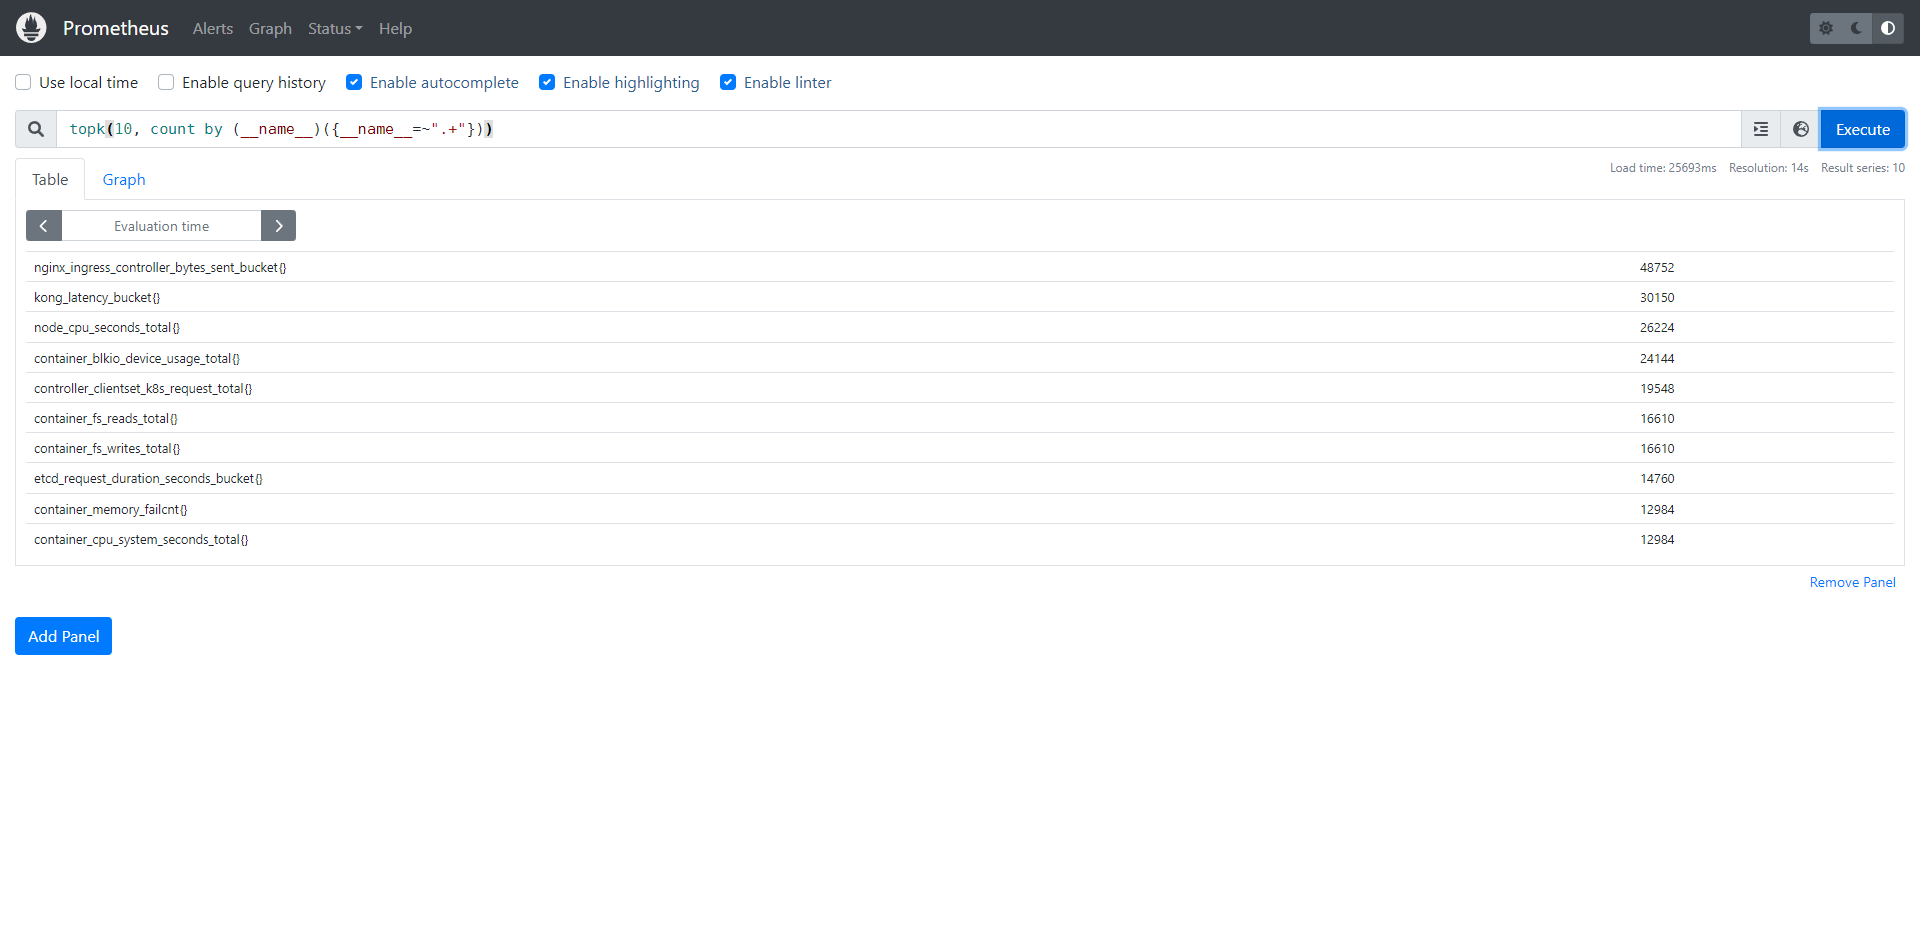
其他类型指标获取请自行查阅相关指令获取,我们只展示本次我们需要用的。在这里,我们获取到我们想要的指标了以后,就可以拿来配置指标过滤了。
mimirtool
Grafana 出品了一款工具: mimirtool, 可以通过对比 Prometheus 的指标, 和 AlertManager 以及 Grafana 用到的指标, 来分析哪些指标没有用到。
安装
|
|
使用
我们的 Prometheus 实例在 kubernetes 集群内,我们先把 pod 名导出到环境变量,后面导出 rules 要用到。
export my_prometheus_pod="prometheus-rancher-monitoring-prometheus-0"
我们先提前在 Grafana 里面创建一个只读 api key ,供我们分析用,我们使用以下命令导出已被 Grafana 使用的指标。
./mimirtool analyze grafana --address=https://your-grafana-instance-address.com --key=eyJrIjoiS0RYeTlHxxxxx
执行完以后默认会在执行命令的当前目录生成 metrics-in-grafana.json 文件,用于后面的分析。
然后,我们需要从 Prometheus 的监控规则文件获取到哪些指标被用于监控告警,此处我们导出所有监控规则文件,多个文件需要合并,且首行以 groups: 开头。
|
|
分析合并过后的规则文件。
./mimirtool analyze rule-file my-prom-rules.yaml
执行完以后默认会在当前目录生成 metrics-in-ruler.json 文件,用于后面的分析。
分析哪些指标是已被使用和未被使用的。
|
|
我们看到总共有 4008 个指标,其中有被Grafana 或 Prometheus 规则使用的有 937 个,使用率 937/4008,剩下的 3067 个指标是没有被用到的,执行完以后默认会在当前目录生成 prometheus-metrics.json 文件。
提取正在被使用的指标:
jq -r ".in_use_metric_counts[].metric" prometheus-metrics.json | sort > used_metrics.txt
提取没有被使用的指标:
jq -r ".additional_metric_counts[].metric" prometheus-metrics.json | sort > unused_metrics.txt
过滤指标
我们使用的 Prometheus Operator ,使用场景比较复杂,有通过 consul 对外部的资源接入进来监控,同时也监控着 kubernetes 集群内的资源。
接入方式的不同,配置指标过滤方法也不一样,按我们的场景来说,分别有 2 种配置方式。
我们通过上面的方法,拿部分指标来做演示,具体要过滤什么指标,请根据自己的场景自行调整。
serviceMonitor
通过 ServiceMonitor 配置的,我们需要通过配置 metricRelabelings 和 relabelings 来对指标进行过滤,我们过滤掉 nginx_ingress_controller_(response_size_bucket|response_duration_seconds_bucket|request_size_bucket|request_duration_seconds_bucket) 这一些没怎么用到的指标。
|
|
配置 metricRelabelings 即可,relabelings 这里是作为 demo ,防止以后要用到不知道怎么配置。
additional-scrape-configs
对于集群外的 consul 部分的配置,我们需要对 additional-scrape-configs 这个字典进行配置,省略号为配置截断,不然一大坨配置贴上来也没什么意义。
|
|
配置 metric_relabel_configs 即可,relabel_configs 这里是作为 demo ,防止以后要用到不知道怎么配置。
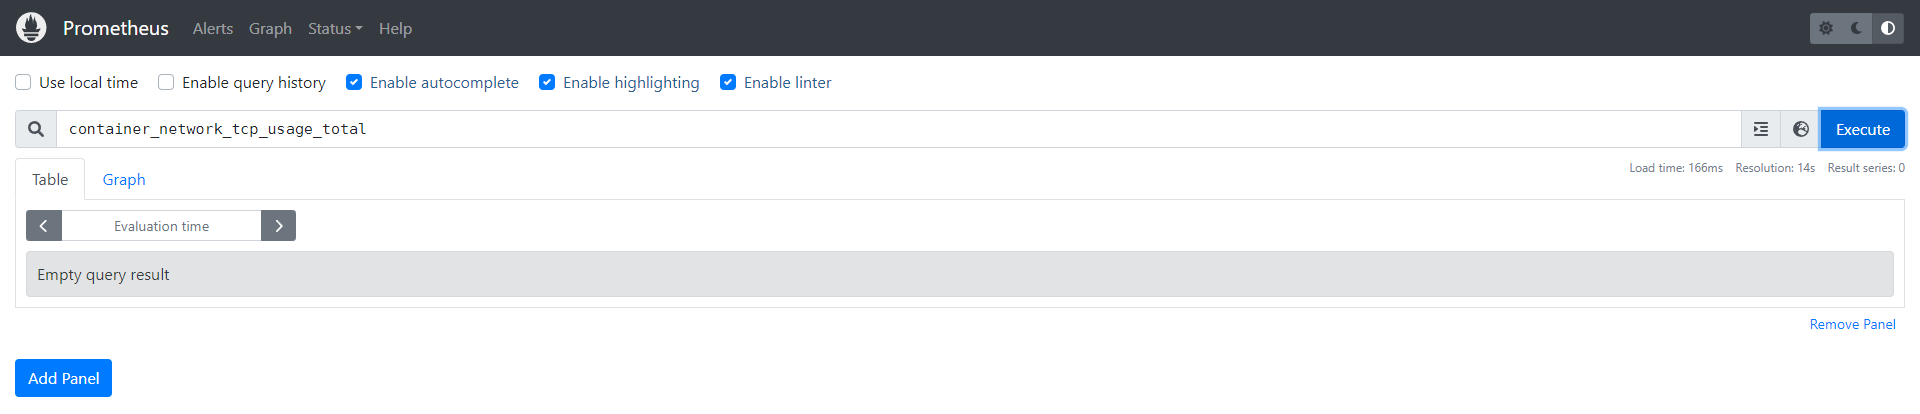
通过上面的配置我们可以得知,我们废弃了 rocketmq_client_consume.* 和 container_(network_tcp_usage_total|network_udp_usage_total|tasks_state|cpu_load_average_10s|cpu_usage_seconds_total|memory_failures_total) 这一坨指标。
得 Prometheus 更新规则或者触发它更新规则生效即可。生效完再查就可以看到已经查不到对于的指标了。
relabel 的区别
在Prometheus中,relabel_configs 和 metric_relabel_configs 是两个用于重新标记时序数据的配置选项。
两者的主要区别在于:
-
relabel_configs 用于修改元数据标签,元数据标签即配置中的 source_labels 包括(可从 Prometheus UI 的 target 页面查看)
__name__、__address__、__meta_filepath、__metrics_path__、__scheme__、job以及 target 中手动添加的其他标签。 -
metric_relabel_configs 用于修改从客户端处抓取到的 metric 的标签。
优化结果
一开始 23GB 左右 ,废弃一些指标后,降到 12GB 左右。
pprof 分析资源占用
优化部分指标以后,虽然内存占用下降,但还是占用了相当大一部分内存,我们想继续深入了解一下内存占用,为此我们必须借助 pprof 工具来分析。
浏览器访问 pprof 地址,导出相应的 pprof 文件。
|
|
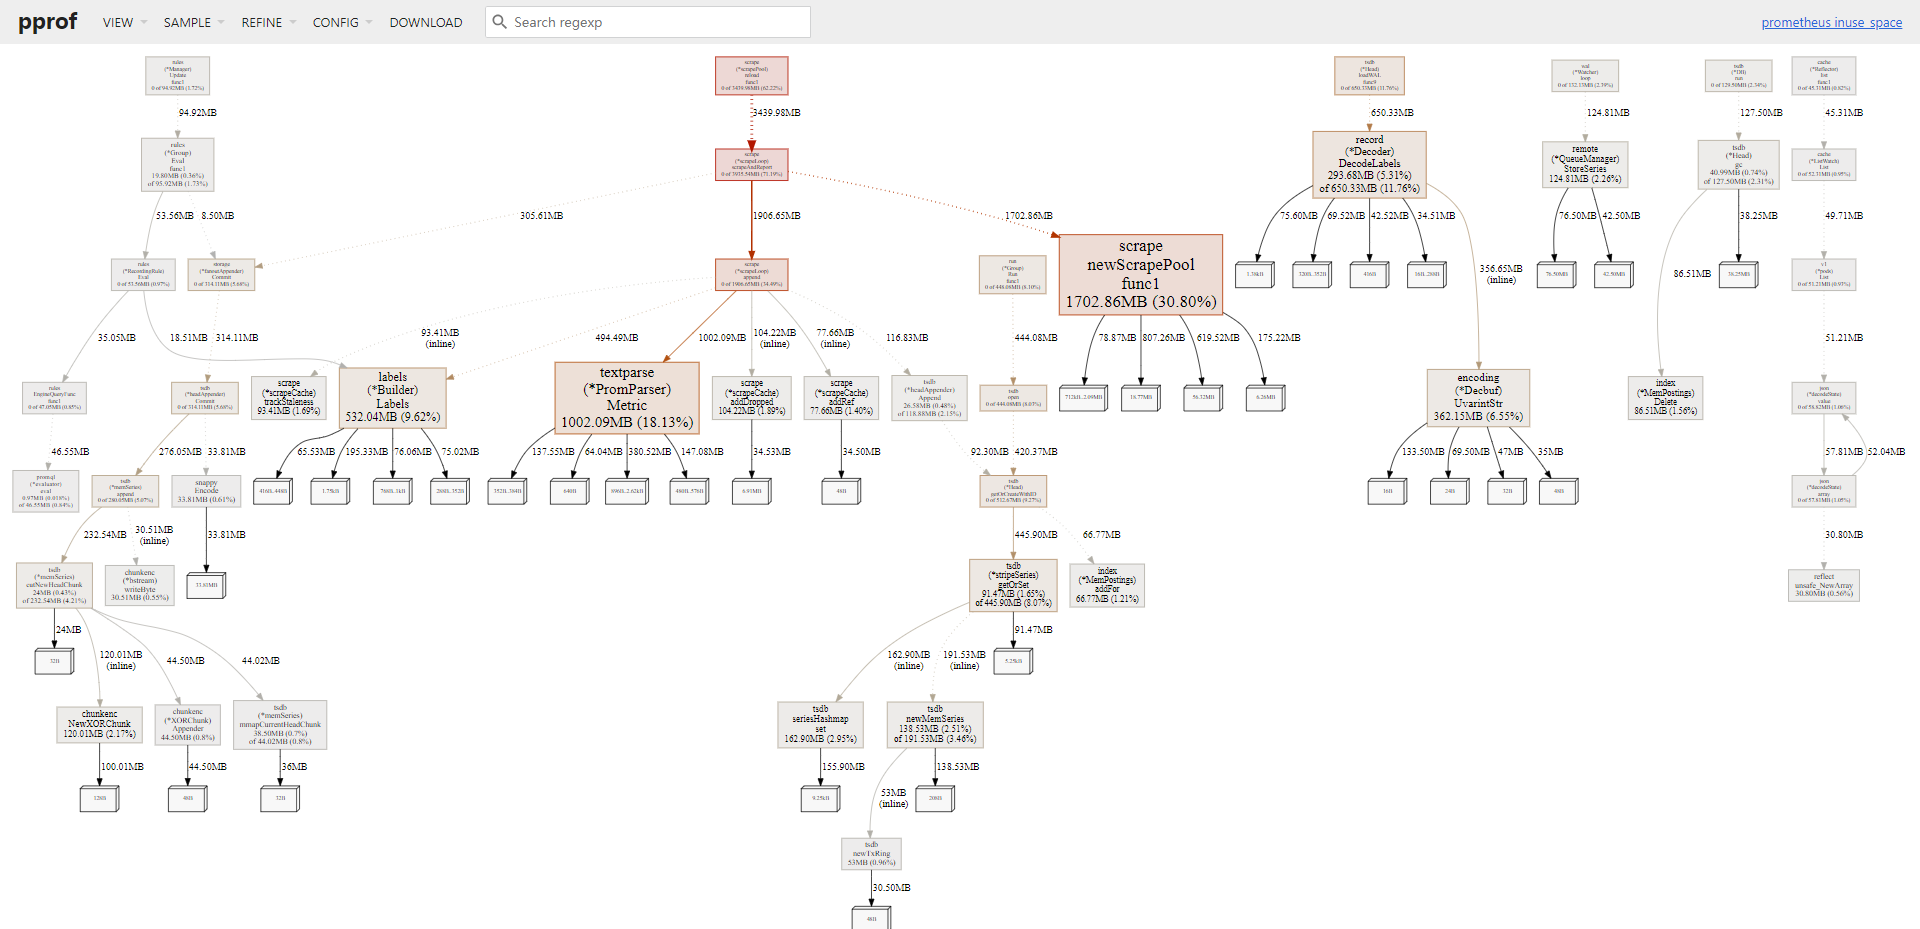
比如我们要分析堆内存。
|
|
打开 web ui 即可对此进行分析。
切换到火焰图更容易理解。
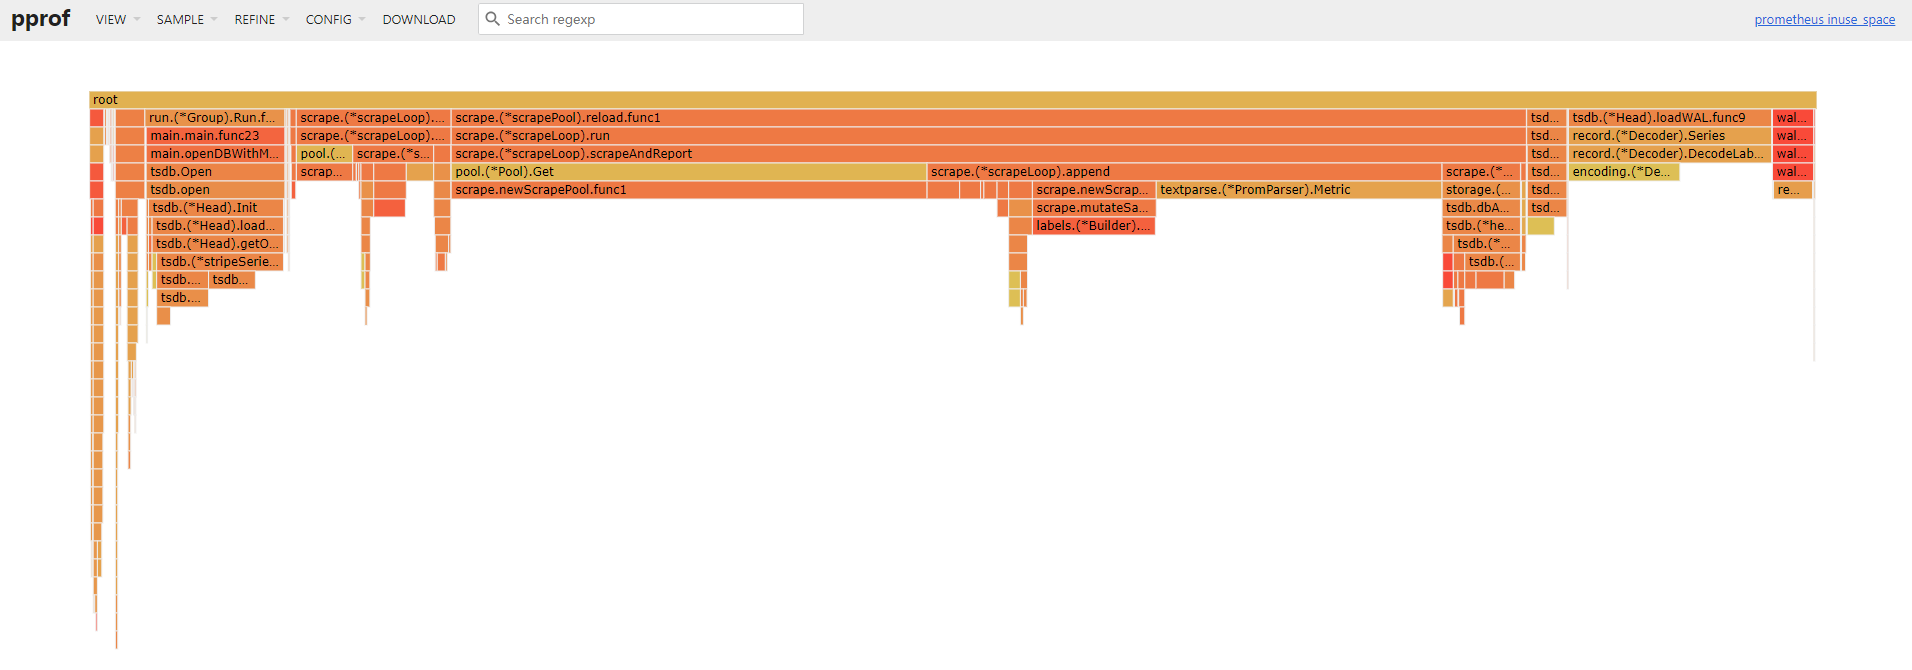
我们可以看到,指标解析仍然花费了接近 1GB 的内存,指标抓取花费了接近 4GB 的内存占用,所以等指标优化完,接下来就是优化指标抓取时间间隔这一块。
调整数据落盘时间
另外,我们也可以通过调整数据落盘时间,来减少内存的占用。
本地存储的一些启动命令的解释:
-
--storage.tsdb.min-block-duration: 单个块中最小存放的数据。 -
--storage.tsdb.max-block-duration: 单个块中最大存放的数据。 -
--storage.tsdb.retention: 块(本地数据)的过期时间。
假设有如下设置:
-
--storage.tsdb.max-block-duration 1h -
--storage.tsdb.min-block-duration 15m -
--storage.tsdb.retention 2h
再假设你在今天的 16:00 搜索了数据,那么你最多可以搜索到今天 13:00 (即16-2-1) 的数据。而最少也可以搜索到 13:45 往后的数据。
总结
-
可以借助工具 mimirtool 对指标进行分析。
-
可以调整落盘时间。
-
可以调整抓取时间间隔。
-
废弃指标配置的方式有集群内和集群外的额外配置。
-
relabel_configs 和 metric_relabel_configs 只在其中一个阶段中去配置即可,本文都配置只是便于日后翻阅查看用。